‘To the naked eye, our sun is an unremarkable ball of heat and light. Under the eye of the Solar Dynamics Observatory, the sun is a seething maelstrom of magnetic phenomena, coronal mass ejections, sunspots, and solar flares’ https://www.youtube.com/watch?v=lpzCSZ7Eerc
Earth is about the size of an average sunspot! https://weathercycles.wordpress.com/timo-niroma/ & https://www.flickr.com/photos/roncottrell/14809056583/
Solar facts
- Its volume would contain 1,304,000 Earths.
- The Sun’s mass is 1,989,100,000,000,000,000,000 billion kg or 333,000 Earths. This is 99.86% of the total mass of our Solar System, about three quarters of this mass is hydrogen and the rest is mostly helium with much smaller quantities of heavier elements, including oxygen, carbon, neon and iron.
- Suns surface gravity is 28 times that of Earth.
- Sun diameter = 1,392,000 km – 109 times bigger than Earth
- Circumference 4,366813 km
https://en.wikipedia.org/wiki/Sun & http://nssdc.gsfc.nasa.gov/planetary/factsheet/sunfact.html
Size of sun (1,392,000 km dia) compared to earth https://www.youtube.com/watch?v=g2CJKAGNvfU
Size of earth (12,742 km dia) compared to a solar flare https://www.youtube.com/watch?v=HFT7ATLQQx8 at 1.1mins.
Diagram of the Solar System (planets & sun to scale, distances not) http://www.universetoday.com/15878/diagram-of-the-solar-system/
The sun has no influence on climate !! “the warming in the last 20 to 40 years can’t have been caused by solar activity,” said Dr Piers Forster from Leeds University,” http://news.bbc.co.uk/1/hi/sci/tech/6290228.stm
That’s not science….that’s stupidity. Why is it hot in the tropics & cold at the poles ?….It’s the sun, stupid.
The Sun heats the Earth; when its radiation increases, the Earth warms, when the radiation falls, Earth cools.
Simples !!
• The earths surface is a giant solar energy collector, any fluctuations in solar output have significant consequences for us.
In absolute terms 0.1% variation in solar power corresponds – on striking the earth – to 0.174 petawatts (PW) of incoming solar radiation. That is to say 174,000 gigawatts.
To put it in perspective, current total world energy consumption is only around 3,500 gigawatts.
A 0.1% solar variation is 50 times greater. https://en.wikipedia.org/wiki/Solar_energy
https://en.wikipedia.org/wiki/World_energy_consumption In 2012, the IEA estimated that the annual world energy consumption was 155,505 terawatt-hour (TWh),
I find it sad that so few people seem to have any idea of how trivial we and our planet are in relation to the sun – let alone the cosmos. “Climate scientists” seem especially weak in this area.
These simplistic videos show relative sizes of the planets and how far they really are from the Sun https://www.youtube.com/watch?v=MK5E_7hOi-k – https://www.youtube.com/watch?v=aY_NfuZlFxc
So you think you’re big? – https://www.youtube.com/watch?v=zaOPsmlJyw8 – https://www.youtube.com/watch?v=Fj_PjkQqrDo
Diagram of the Solar System (planets & sun to scale, distances not) http://www.universetoday.com/15878/diagram-of-the-solar-system/
Good primer for the solar system – http://www.universetoday.com/15451/the-solar-system/
The coolest periods on the planet recently have been:
- 1890-1918 (Jan 1893 was the coldest month in the modern temperature record);
- 1808-1816 Dalton Solar minimum (1816 was “the year without summer”);
https://en.wikipedia.org/wiki/Year_Without_a_Summer - 1660-1699 Maunder Solar minimum (coldest part of the Little Ice Age).
How much of a coincidence is it that these are also the periods of lowest solar activity ??
The Sun’s Chilly Impact on Earth. http://www.giss.nasa.gov/research/news/20011206/
Sunspots
Basic info – https://en.wikipedia.org/wiki/Sunspot
Wonderful photos of Sun with spots & flares with Earth for scale – https://www.flickr.com/photos/roncottrell/page1
Good sites to explore Sunspots https://www.exploratorium.edu/sunspots/index.html & http://sidc.oma.be/silso/yearlyssnplot & http://solarscience.msfc.nasa.gov/SunspotCycle.shtml & http://www.landscheidt.info/?q=node/50
Planetary influences on the sun – http://www.landscheidt.info/
The Sun has got his hat balaclava on !!
Solar Cycles, [nothing to do with electric bikes] are ~ 11yrs
Observations of Solar Activity (Mg II Index) by GOME, SCIAMACHY, and GOME-2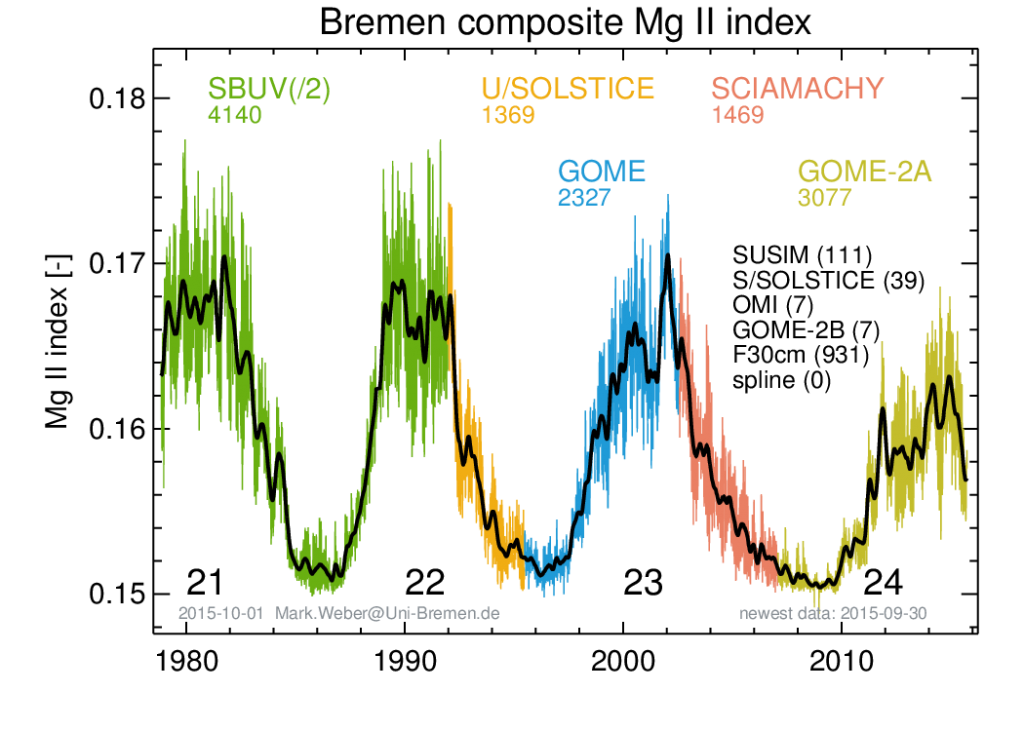 http://www.iup.uni-bremen.de/gome/gomemgii.html
Solar Cycle 23 ending in 2007 was quite vigorous.
The present Solar Cycle 24 started 2008 & is on track to be the weakest in 100 years.
Solar Cycle 25 starting 2020 is predicted be one of the weakest in centuries.
The next Grand Solar minimum appears to be imminent possibly within our life time!
See what the Dalton & Maunder Solar minimums did for to us !!
https://en.wikipedia.org/wiki/Dalton_Minimum (1790-1830)
https://en.wikipedia.org/wiki/Maunder_Minimum (1645-1715)
Professor Valentina Zharkova of Northumbria University work seems to point to a further reduction
– see first article
http://astronomynow.com/2015/07/09/royal-astronomical-societys-national-astronomy-meeting-2015-report-4/
& also http://science.nasa.gov/science-news/science-at-nasa/2006/10may_longrange/
The sun undergoes cyclical changes that appear to correlate with earth temperatures. Cycle 23 appears to be the longest in at least a century and may point to quieter subsequent cycles and cooling temperatures ahead.
From – ULTRALONG SOLAR CYCLE 23 AND POSSIBLE CONSEQUENCES http://icecap.us/images/uploads/solarcyclestory.pdf
Here’s solar radiation plotted with surface air temperature –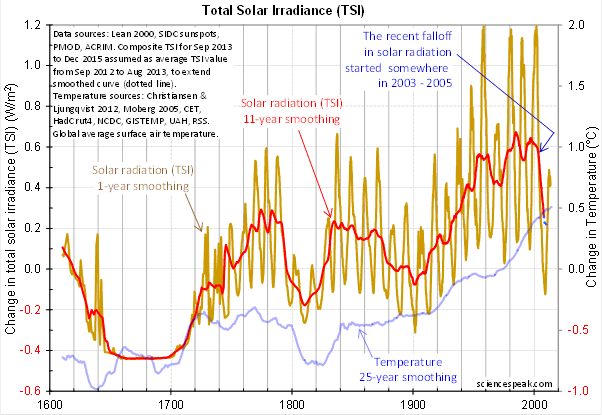
From – https://cbdakota.files.wordpress.com/2014/07/evanstotal-solar-irradiance-1-1.gif
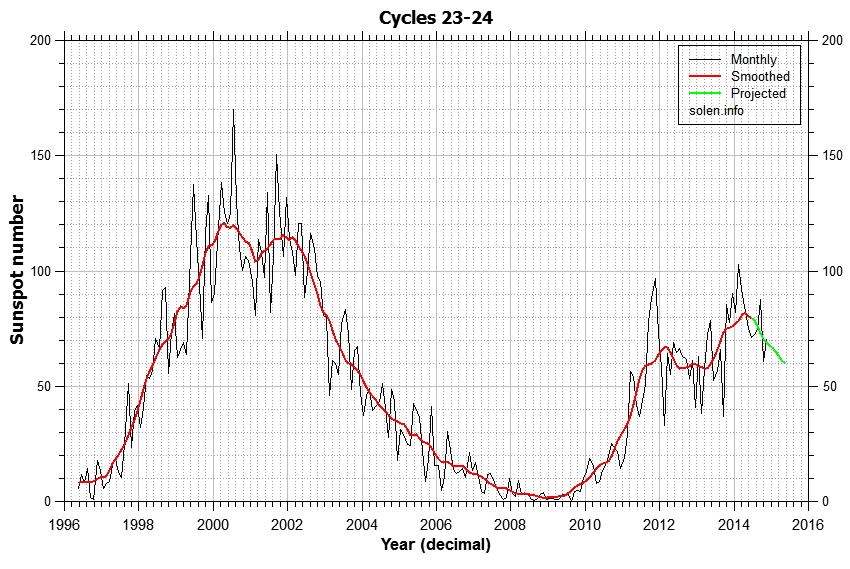 https://cbdakota.files.wordpress.com/2015/01/cycles23_24comparison2014.png
Dec. 21, 2006: Evidence is mounting: the next solar cycle is going to be a big one.
Solar cycle 24, due to peak in 2010 or 2011 “looks like its going to be one of the most intense cycles since record-keeping began almost 400 years ago,” says solar physicist David Hathaway of the Marshall Space Flight Center. https://science.nasa.gov/science-news/science-at-nasa/2006/21dec_cycle24/
What actually happened – Solar Cycle 24 actually peaked in 2014 & is on track to be the weakest in 100 years !!
Two cycles of declining sunspot activity suggest a possible cooling trend.
► A longer solar cycle predicts lower temperatures during the next cycle.
► A 1 °C or more temperature drop is predicted 2009–2020 for certain locations.
► Solar activity may have contributed 40% or more to the last century temperature increase.
► A lag of 11 years gives maximum correlation between solar cycle length and temperature. http://www.sciencedirect.com/science/article/pii/S1364682612000417
Solar pages
Lots of charts + good source guide at end http://wattsupwiththat.com/reference-pages/solar/
Sunspots & theory on solar grand minima. http://www.landscheidt.info/?q=node/50
Wonderful photos of Sun with spots & flares with Earth for scale – https://www.flickr.com/photos/roncottrell/page1
Some open access articles on Solar Flare Observations. PDF Downloads.
Arnold O. Benz – Flare Observations (Dec 2016)
https://link.springer.com/article/10.1007/s41116-016-0004-3/fulltext.html
I found it helpful as a quick update to current theory on solar activity.
Also, this recent article by David Hathaway of NASA Ames sums up the current theory of the solar cycle and is easy reading.
https://link.springer.com/article/10.1007/lrsp-2015-4/fulltext.html
The Neglected Sun – Solar Cycles – Sebastian Luning – 15mins
https://www.youtube.com/watch?v=-YAvz44se9Y
Vahrenholt and Luning show that four concurrent solar cycles control the earth’s temperature.
• In a solar eclipse, the air temperature can drop 10 °C in a few minutes & the CO2 in the atmosphere doesn’t do didily-squat to stop the heat loss.
If it’s cloudy you don’t see the eclipse it just gets dark, but temperature remains the same, therefore water vapor is the controlling factor, NOT CO2. QED.