Britain has some of the worlds longest running continuous weather records in the world, known as the Central England Temperature series (CET) started in 1659 & held by the Met Office..
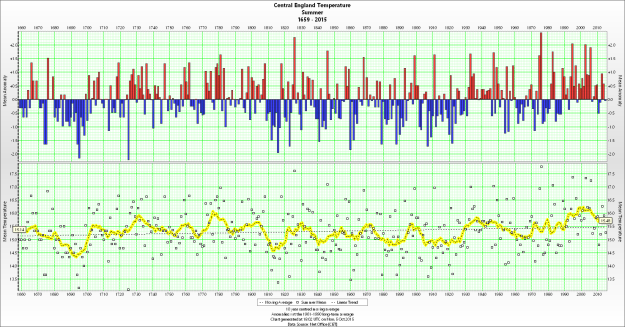
Central England temperatures 1659 – 2016 Chart from
![]()
10 yr Trend lines – °C
| 1665 | 2010 | Change °C in 345yrs | |
| Summer | 15.4 | 16 | +0.6 |
| Winter | 3.4 | 4.6 | +1.2 |
| Annual | 9.1 | 10.2 | +1.1 (0.3/decade) |
Central England Temperature trends 1659 – 2015

?——-? (right click on image to enlarge)
Yellow line is the gradual warming from 1659-2015 [356yrs] (0.028°C/decade).
Green line is the rapid acceleration (attributed to CO2 ) from 1966-2015 (0.197°C/decade).
SO…What caused the even more rapid acceleration from 1695-1734 (0.45°C/decade).??
Clue – It’s Not CO2
Lots more on Central England Temperature trends here.
The Medieval Warming from 800 to 1300 AD (that Michael Mann erased to make his “hockey stick” chart work), was several degrees warmer than anything “global warmers” fear. It was the longest recorded time (500 years) of relative peace, and brought great abundance for all.
It was replaced by the Little Ice Age 1550 to 1850 AD, that brought – crop failures, famine, disease, wars & migration; it was not a good time.
UK – actual temps
The TV & newspapers tell us constantly that each year is the (hottest, coldest, driest, or wettest) !!
The 410 years of met office records say –
1833 @ 15.1°C was the hottest May on record followed by-
1848 @13.9°C .
1758 & 1788 both @13.8°C .
1808 @13.7°C .
1992 @13.6°C .
• May 2014 is ranked number 65 @ 12.2 °C
• 1929/30 was Britain’s wettest year in the last 2 centuries.
• The average Central England Temperature in 2013 was the same as …. 1666. –
• The “UK hottest summers ever !” were – 1826 & 1976
• The “UK coldest winters ever !” were – 1740, 1884, & 1964
• The “UK hottest years ever !” were – 1733, 1780, 1950, 2005,
• The “UK coldest years ever !” were – 1695, 1741, 1879,
UK Summers Getting Cooler & the met office data.
All the monthly averages from 1659-2017 from the Central England temperature set (CET)
http://www.metoffice.gov.uk/hadobs/hadcet/mly_cet_max_sort.txt
BUT what difference 5 years of extra observation makes: the last few summers have cooled
See- https://notalotofpeopleknowthat.wordpress.com/2015/10/05/uk-summers-getting-cooler/
Even with the continued increase in CO2 & all the dire predictions of British summers being like southern Spain, we’ve warmed only +0.6°C in 357 yrs (1659).
We are still 2°C colder than when the Romans were here; and sadly there has been NO global warming for the last 18 yrs. See – https://wattsupwiththat.files.wordpress.com/2014/03/clip_image004_thumb7.png
So maybe the science isn’t settled & CO2 isn’t the bogyman after all.
Surface Temperature Recording
Normally collected at fixed registered sites
But there are a few problems with data collection-
Have a look at this PDF which explains what sites make up CET:
http://www.metoffice.gov.uk/hadobs/hadcet/Parker_etalIJOC1992_dailyCET.pdf
You will note that many of them that used to be in the countryside are now in built-up urban area’s so are also recording heat emanating from buildings, traffic etc, resulting in ‘The Heat Island Effect’
I know the one at Weston Park in Sheffield (Google Maps).
Started in 1882 in a leafy suburb when transport was horse & cart, it’s now just ~25m from the busy A57, a major bus route on a steep hill. It’s close to two large concrete hospitals (the Children’s, 50m, & Western park 100m).
They use the large tarmac area 10m to the left to land the air ambulances, often there is an Ice cream van parked at the gateway with its engine running 20m away (you can see it in the sat view); so lots of false heat sources.
How meaningful can it be to compare current & historical measurements??
Oxford is shown in here – https://notalotofpeopleknowthat.wordpress.com/2015/07/14/heat-island-at-heathrow/
Somerset House, London (Google Maps)
Heathrow (where they recorded the hottest day ever…just as 87 plane movements happened in that hr, near the recording station , situated at the eastern end of the north runway [ just where engines were on max thrust for take off ] & next to a road & car-parks. The prevailing wind is from the southwest, so blew hot gasses over the thermometers.)
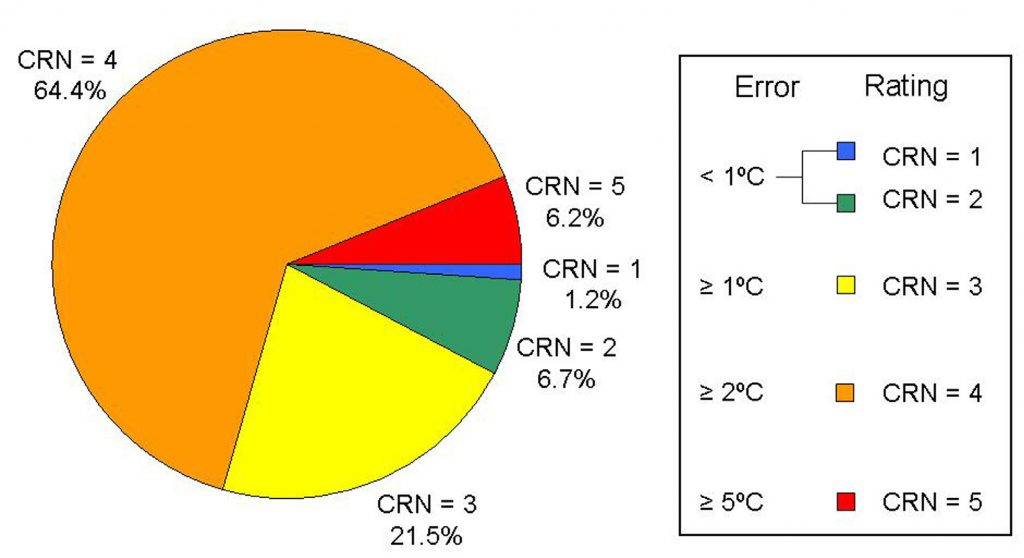
Another 178 UK Met stations, to be Class 1 they need to be 100m from any buildings concrete surfaces, and parking lots; you can check how good they are here – https://tallbloke.wordpress.com/index-page-surface-stations-project/
Only 7.9% of NOAA temperature stations are accurate to less than 1C
Yet NOAA claims precision of global temperature estimate to 0.01C.
(How do you get precision 200x the accuracy of the measuring instrument…. without lying ??)
Lots more info from – http://www.surfacestations.org/