This is the identical wildly exaggerated rhetoric being used by ‘scientists’ in 2016. All nonsense, all the time.
Greenland’s average monthly temperature ranges between -2 & -30°C
“Greenland is losing mass at about 200 Gt/yr”
Absolutely true & frightening…until…A quick glance shows Greenland’s ice at 2.85 million (Gt), so is the occasional “loss” of 200Gt +/- 50% ( 1 part in 14,250 ) really going to show up?
That equates to someone pulling a hair out of their head, and then asking if you can see the difference.
This is the change in Greenland’s Mass Balance over 120 yrs.

The Greenland Ice data shows that have been 9 warming and cooling periods in the last 11,000 years.


So in 2016 (the ‘hottest year ever’) we find the temperature is lower than 1895, well before CO2 levels increased; do you still think CO2 drives climate ?
The Greenland Environmental Observatory is at Summit Station http://www.summitcamp.org/index
See Greenland Live- Temperature, Wind speed & direction. Auto updates. Also Greenland Live Weather Systems
When it comes to Greenland, we should say, – “Grow some barley in open fields on Greenland & feed people with it, keep 100s of cows & export butter & cheese, just like the Vikings did.
Then we can accept that is as warm as during the Medieval Warm Period.”
But here’s the data anyway-
Showing the recovery (2014-16), from the high melt rate of 2011-12.
Greenland has been gaining about 3 billion tons of ice per day since 1st September 2016.
It’s the highest rate of accumulation in the last 24 years. (Do you still believe it’s the hottest year ever ?)
Top: The total daily contribution to the surface mass balance from the entire ice sheet (blue line, Gt/day).

Bottom: The accumulated surface mass balance from September 1st to now (blue line, Gt) and the season 2011-12 (red) which had very high summer melt in Greenland.
For comparison, the mean curve from the period 1990-2011 is shown (dark grey). The same calendar day in each of the 22 years (in the period 1990-2011) will have its own value. These differences from year to year are illustrated by the light grey band.
From – Danish Meteorological Institute.
You can follow the daily surface mass balance on the Greenland Ice Sheet here –
http://beta.dmi.dk/en/groenland/maalinger/greenland-ice-sheet-surface-mass-budget/
We know that Greenland accumulates ice at ~ 5ft/yr, (the P38 aircraft ‘Glacier Girl’ was recovered in 1992 from 50 yrs of ice…all 268ft of it !! ) –
The following chart shows Greenland’s weekly snow cover since January 1972 according to Rutgers University Global Snow Laboratory.
The thin blue line is the weekly data.
The thick blue line is the running 53 week average (approximately 1 year).
The horizontal red line is the 1972-2015 average.
Last figure update 9 Jan 2017.
It shows a modest increase in Greenland’s weekly snow cover since 1972.
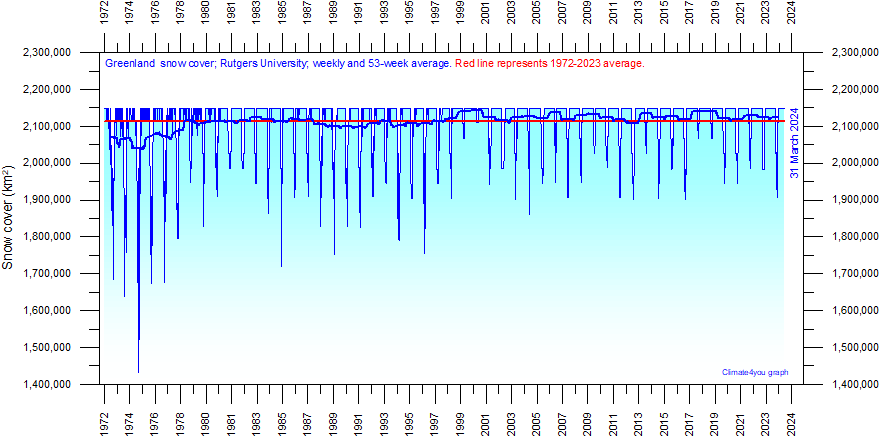
http://www.climate4you.com/images/GreenlandSnowCoverSince1972.gif
But of greater interest for Greenland is the minimum snow covered area reached each summer. This minimum value display variations ( big melts in 1974, 84, 88, 89, & 96.) throughout the observational period since 1966, but the overall trend appears to be that….
The size of the area still covered by snow at the end of the Greenland summer is increasing.
Northern hemisphere weekly snow cover since 1972
http://www.climate4you.com/SnowCover.htm#List%20of%20centents
- More links on ice here- http://www.c3headlines.com/arcticgreenlandantarcticglacierssea-ice/
- The Greenland ice core record – We live in cold times. – https://vimeo.com/14366077 – 4mins
- NASA | Greenland’s Ice Layers Mapped in 3D https://www.youtube.com/watch?v=u0VbPE0TOtQ – 3mins.
1,000 yrs ago Vikings grew Barley in open fields to feed the population & exported butter & cheese.
Today (2014) Greenland produces only limited root crops ~200 ton of potatoes (for 57,000 people = 3kg/person/year) & some salads from heated greenhouses.